Rev_Vis - Visualizing Binary Execution Flow
Why Visualize a Binary?
I wanted a way to see the structure of a binary - how functions relate to each other, where the dense clusters of activity are, and which functions sit at critical junctions in the call graph. Rev_Vis is a tool I built to do exactly that: take IDA analysis and render it as an interactive 3D graph you can fly through and interact with.
How It Works
Rev_Vis connects to a running IDA Pro instance via an MCP plugin, pulls all function data and cross-references, then builds a 3D call graph rendered with Three.js.
The tool can handle large binaries - it loads up to 50,000 functions in a single pass, builds the call graph by analyzing cross-references for each function, then lays everything out in 3D space.
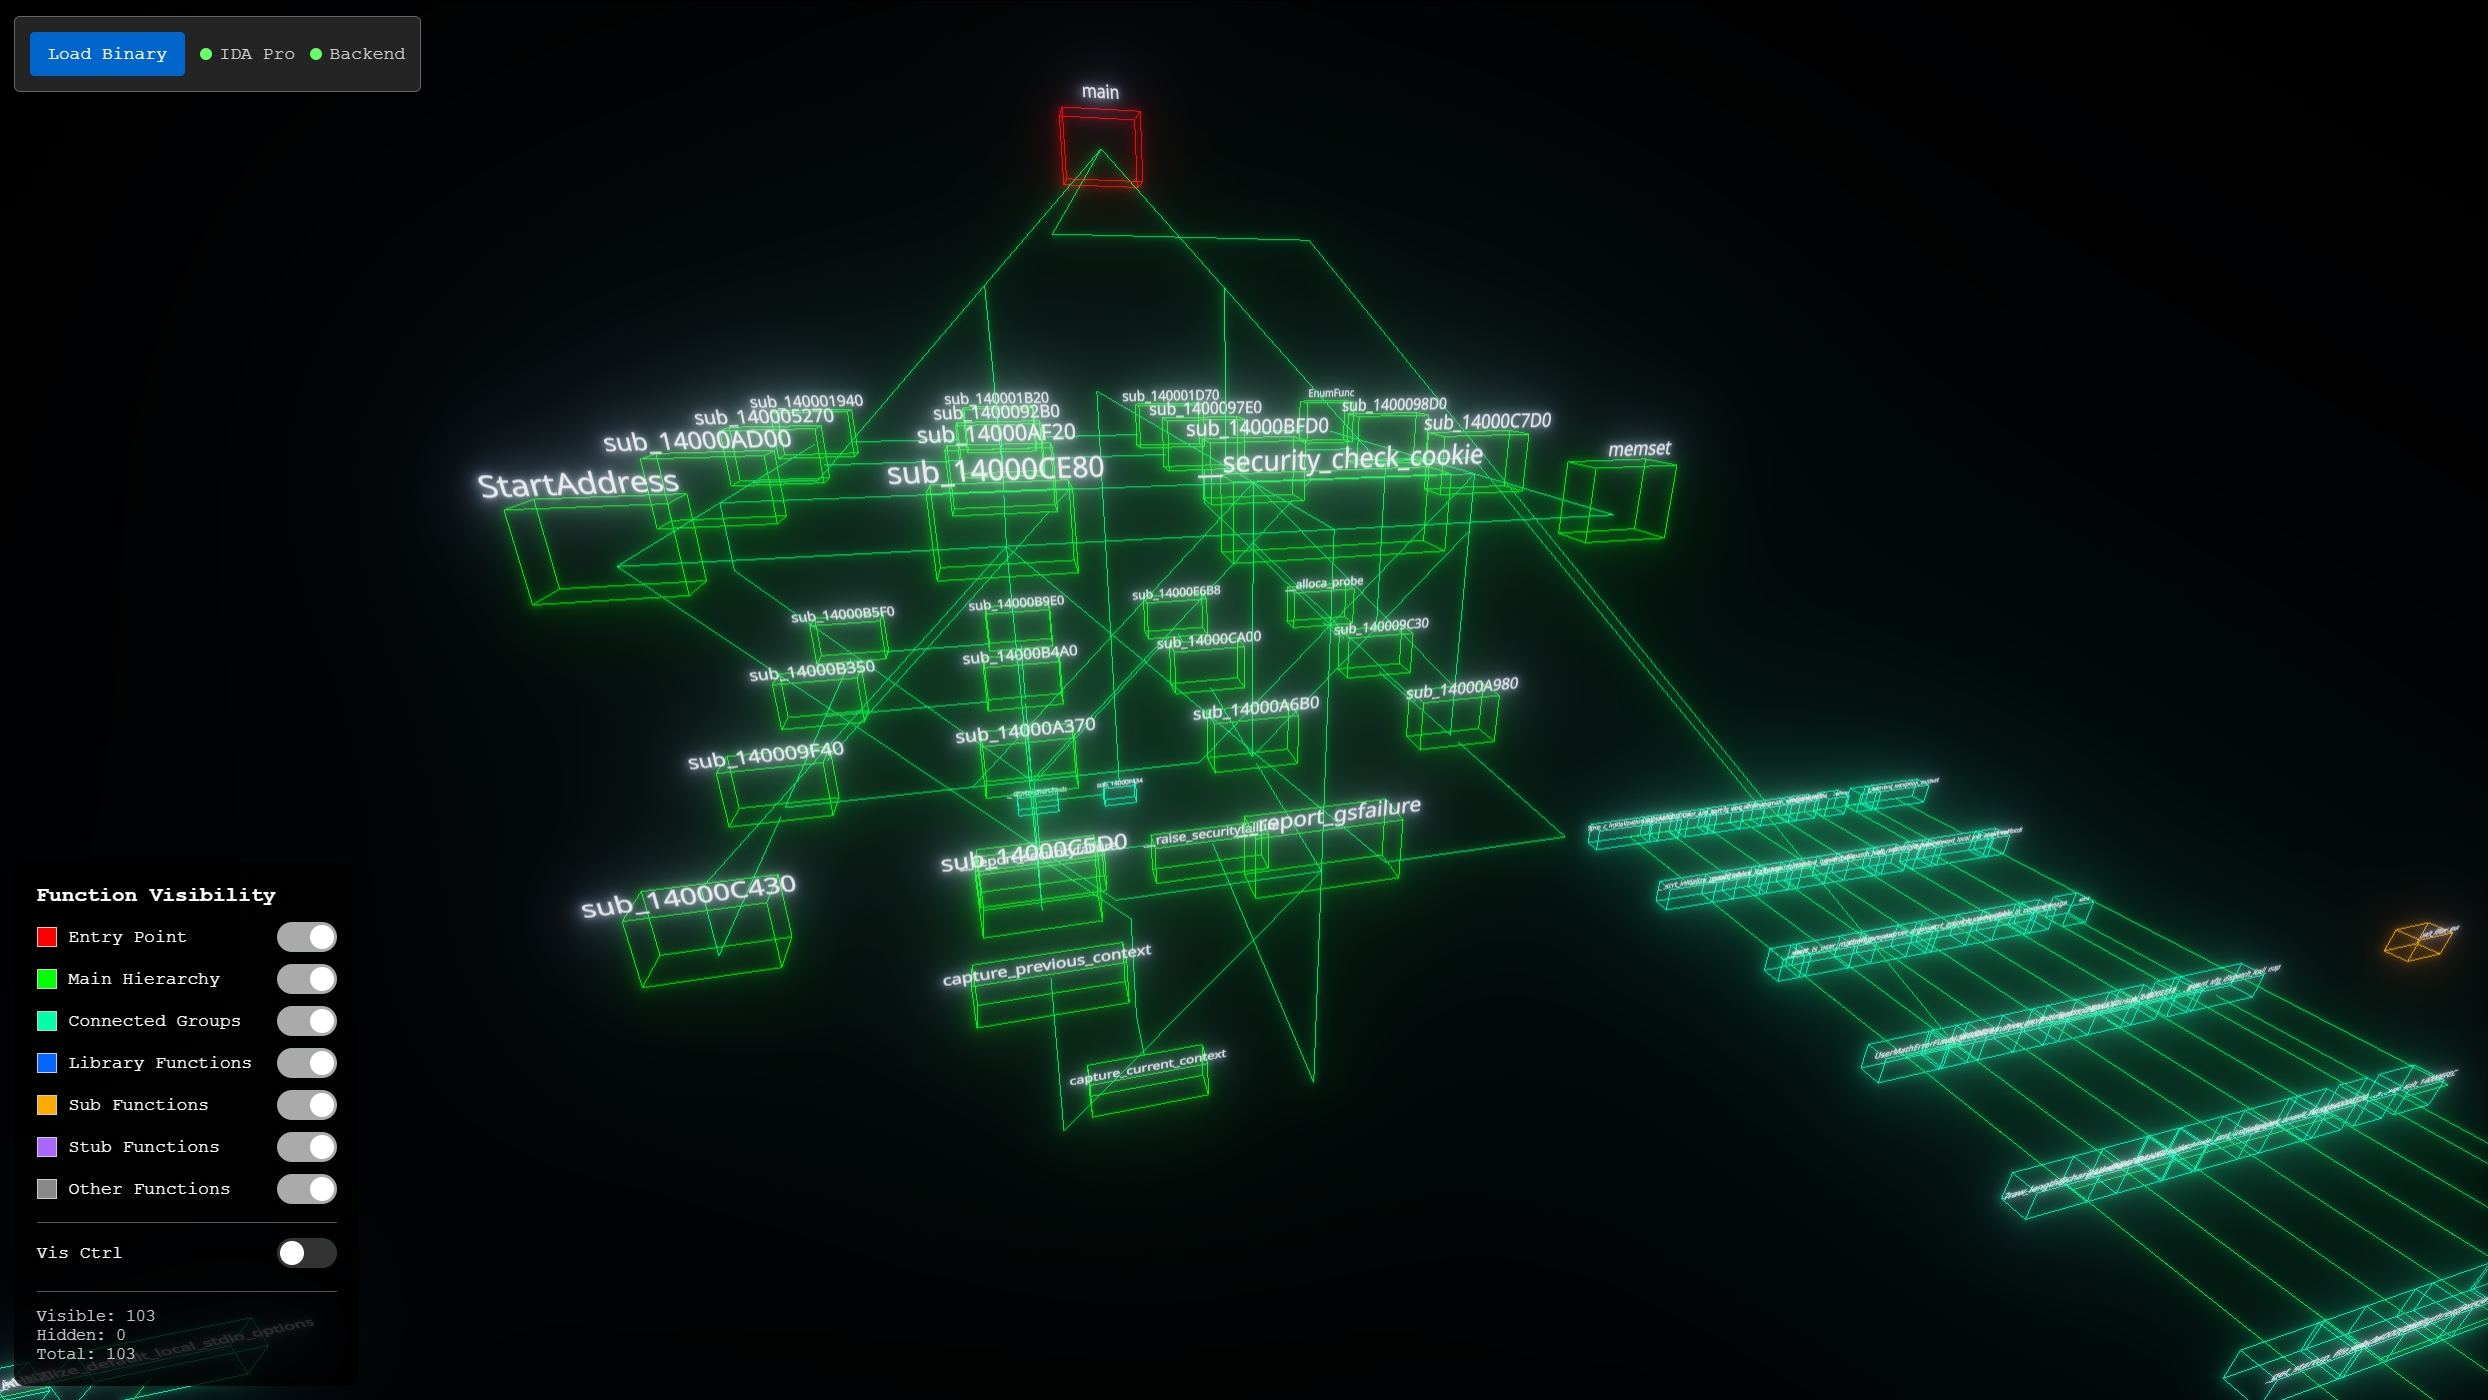 a small crackme binary visualized in Rev_Vis - the entry point (red) sits at the top, with the call hierarchy branching downward and orphaned function clusters off to the right
IDA Pro Integration
The connection to IDA Pro uses an MCP plugin. This means IDA can be running on a separate VM (useful for malware analysis where you want your RE tools isolated), and Rev_Vis connects to it over the network.
Once connected, hitting Load Binary pulls all functions, identifies entry points (with fallbacks to common names like main, WinMain, _main if the standard entry point detection fails), and builds the cross-reference graph.
3D Graph Layout
The layout algorithm is hierarchical, starting from the entry point:
- BFS from entry point - determines hierarchy levels (level 0 = entry, level 1 = direct callees, etc.)
- Vertical stacking - each level is positioned with consistent vertical spacing
- Orphan clustering - functions not reachable from the entry point are grouped into categories and placed around the main hierarchy
The orphan clustering is where things get interesting for reverse engineering. Functions that aren't part of the main call hierarchy are sorted into five groups:
- Connected Components - internally linked function clusters (cyan)
- Library Functions - names matching
lib,std,__prefix patterns (blue) - Sub Functions - IDA's auto-generated
sub_XXXXXXnames (orange) - Stub Functions - short-named utility functions (purple)
- Other - everything else (gray)
Each function is rendered as a rectangular box, with the function name displayed above.
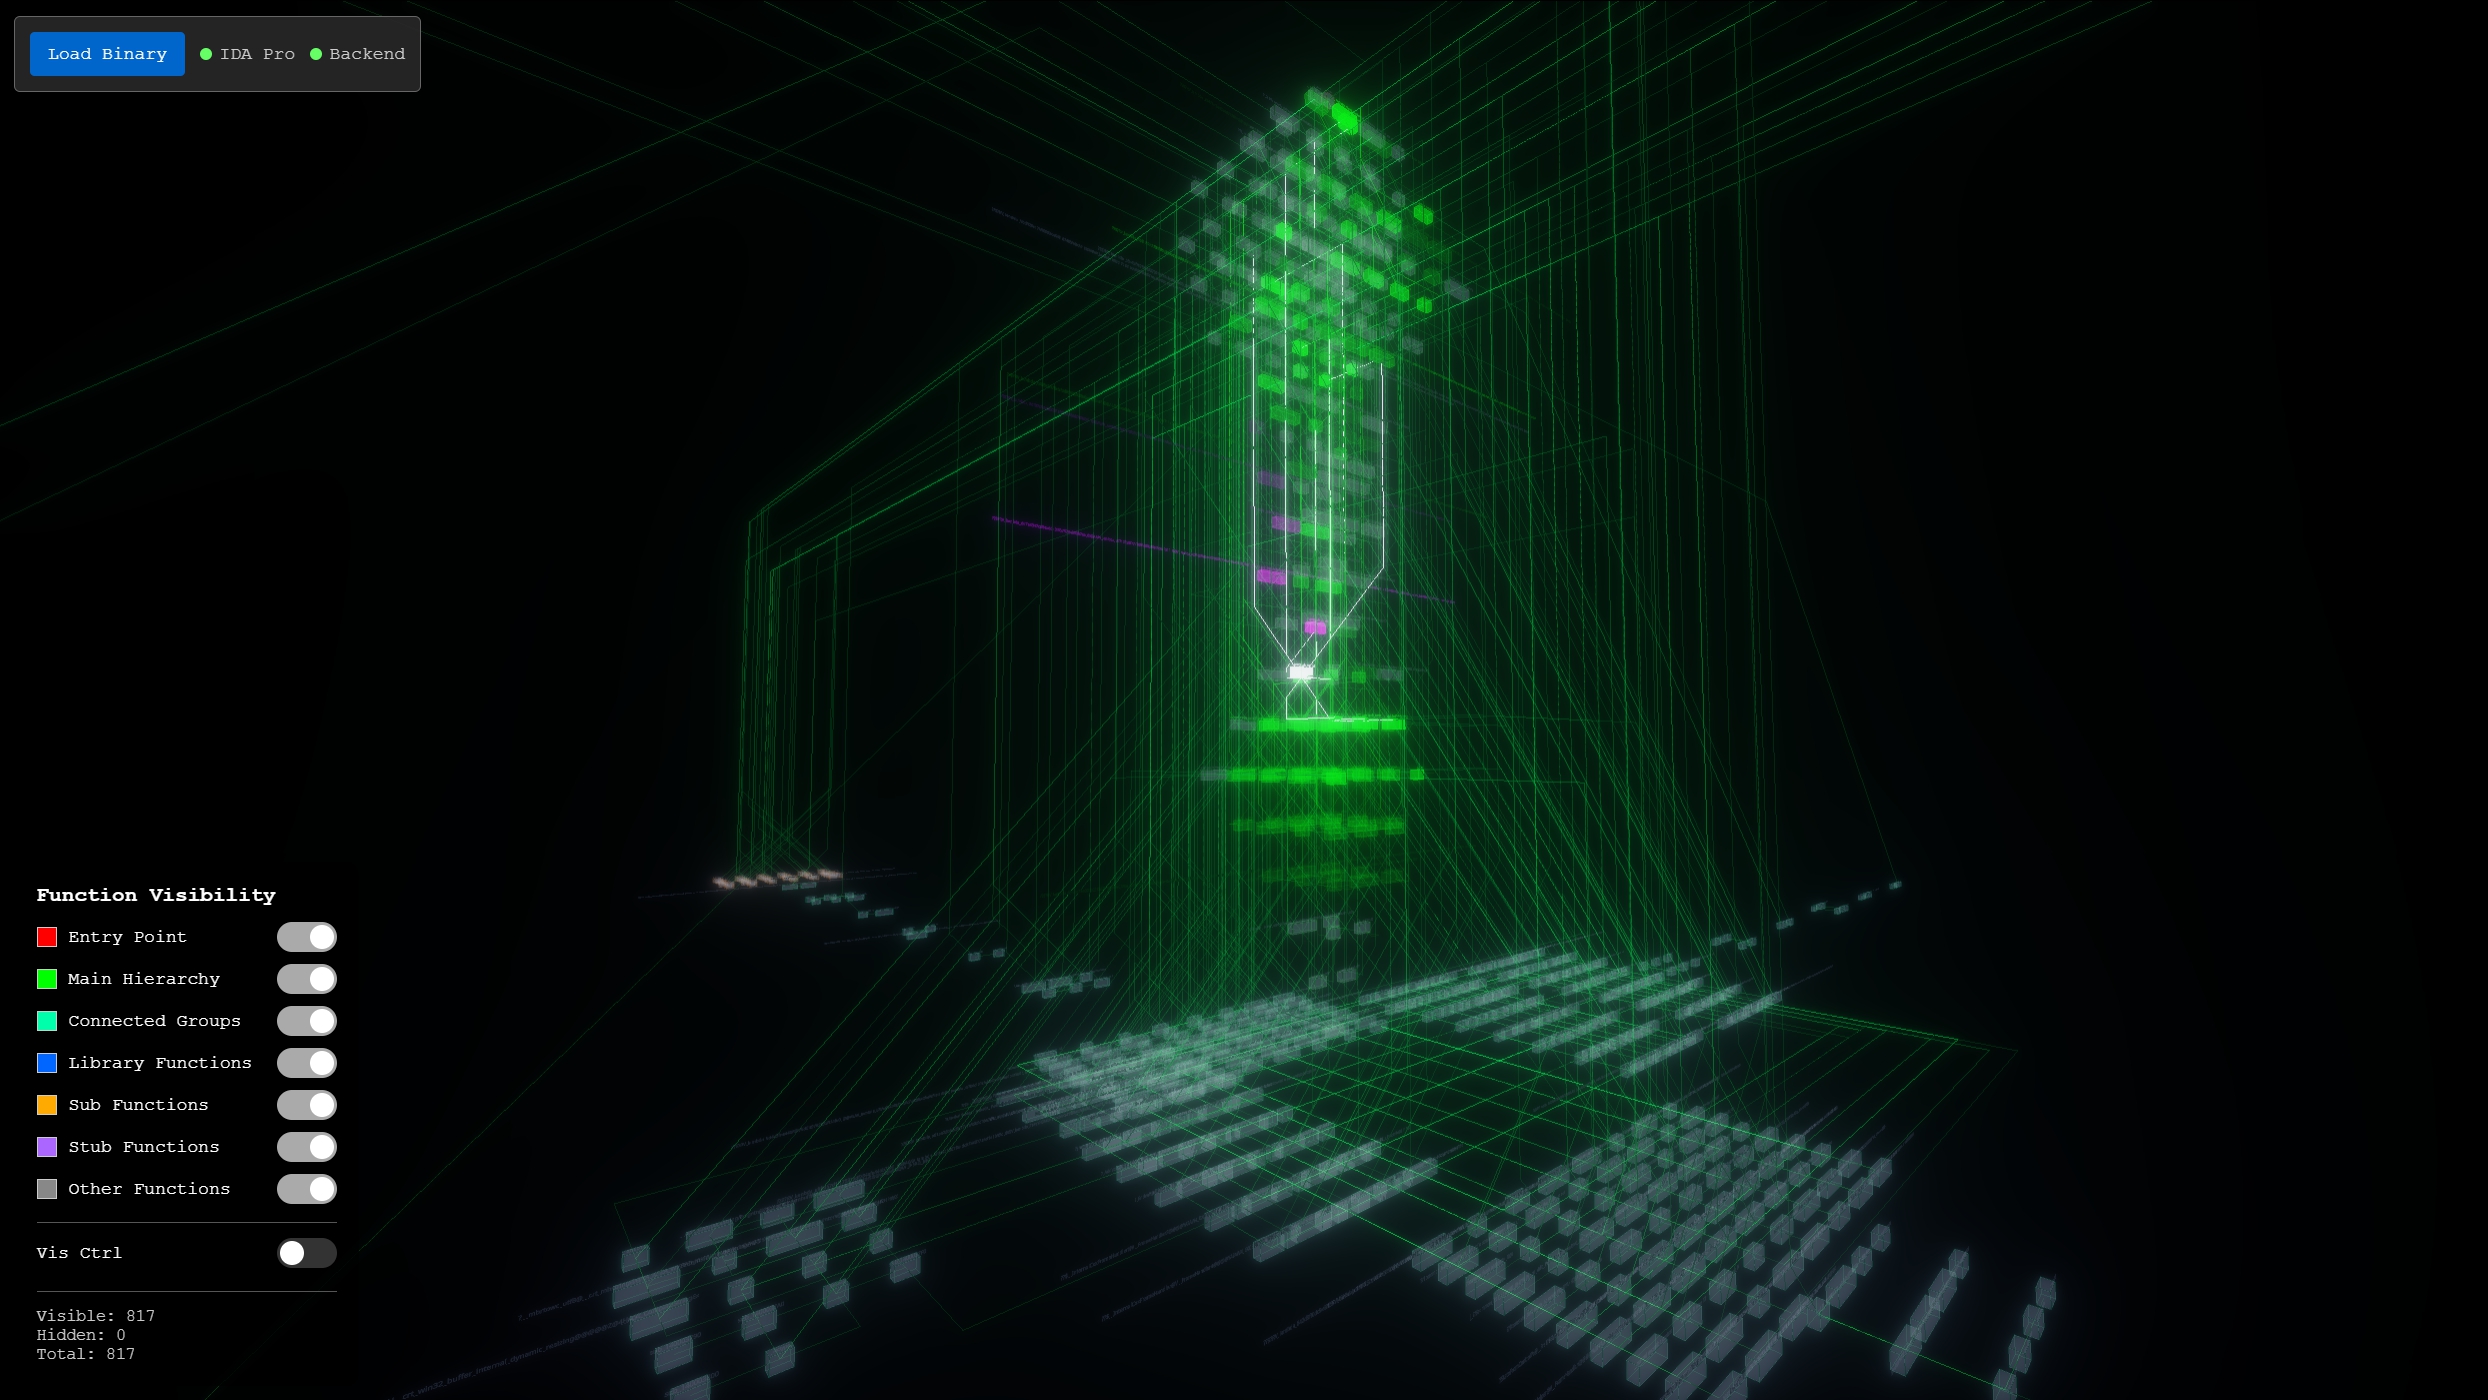
 a larger binary with 817 functions - the main call hierarchy forms a tall central tower, with orphaned function clusters arranged in rows to the sides
For large binaries, clusters with more than 150 functions are recursively subdivided and spread across the scene to prevent overlap. The result is that you can visually distinguish the "shape" of a binary at a glance - malware with heavy API usage will have large library clusters, while a statically-linked binary might have a massive central hierarchy with few orphans.
Navigation and Interaction
Navigation uses free-flight controls - WASD movement with mouse look, similar to a first-person game. This makes it easy to fly through the graph, zoom into dense clusters, and orbit around interesting structures.
Single-clicking a function node opens the info panel on the right side, which shows the function name, address, and ID. From there you can load the decompiled source code directly from IDA Pro.
Double-clicking smoothly transitions the camera to center on the selected function.
Call Path Highlighting
The most useful interaction for reverse engineering is the call path highlighting. When you select a function, Rev_Vis highlights up to 5 levels of:
- Callers (magenta) - functions that call the selected function
- Callees (green) - functions called by the selected function
The highlighting intensity dims with each level of separation, making it easy to trace execution paths through the binary. Everything not connected to the selected function fades to transparent grey, letting you focus on the relevant subgraph.
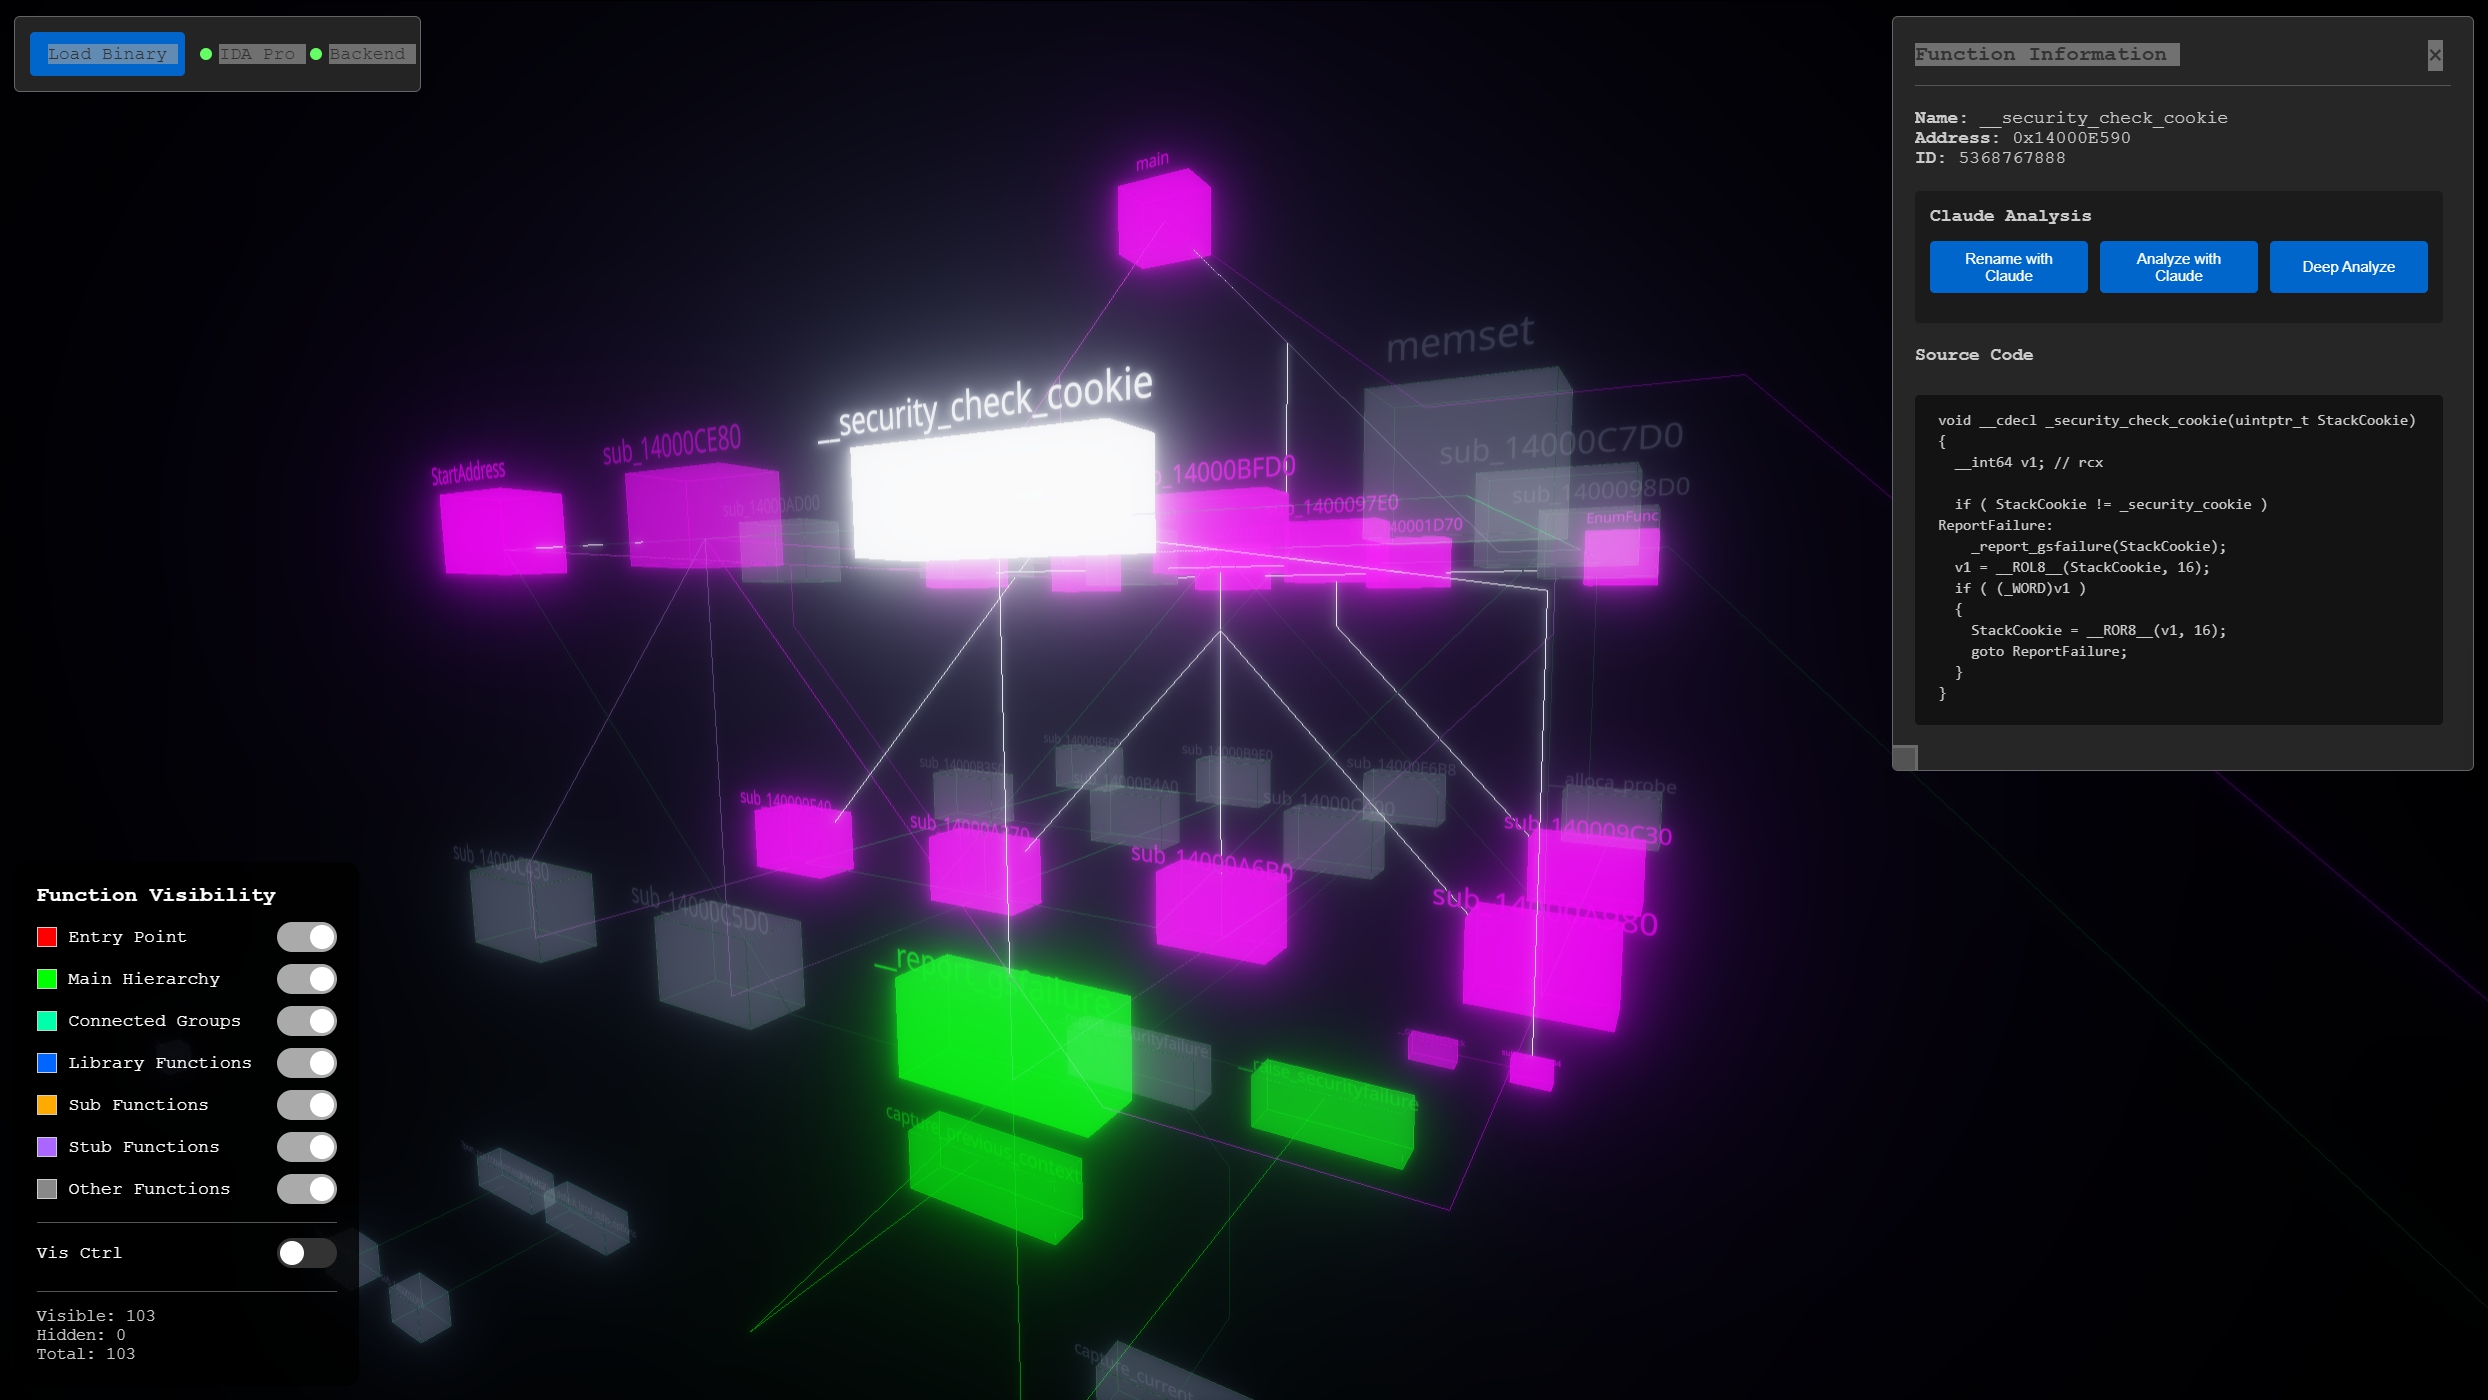 selecting
 __security_check_cookie in a crackme - callers highlighted in magenta, callees in green, with the info panel showing decompiled pseudo-C source code
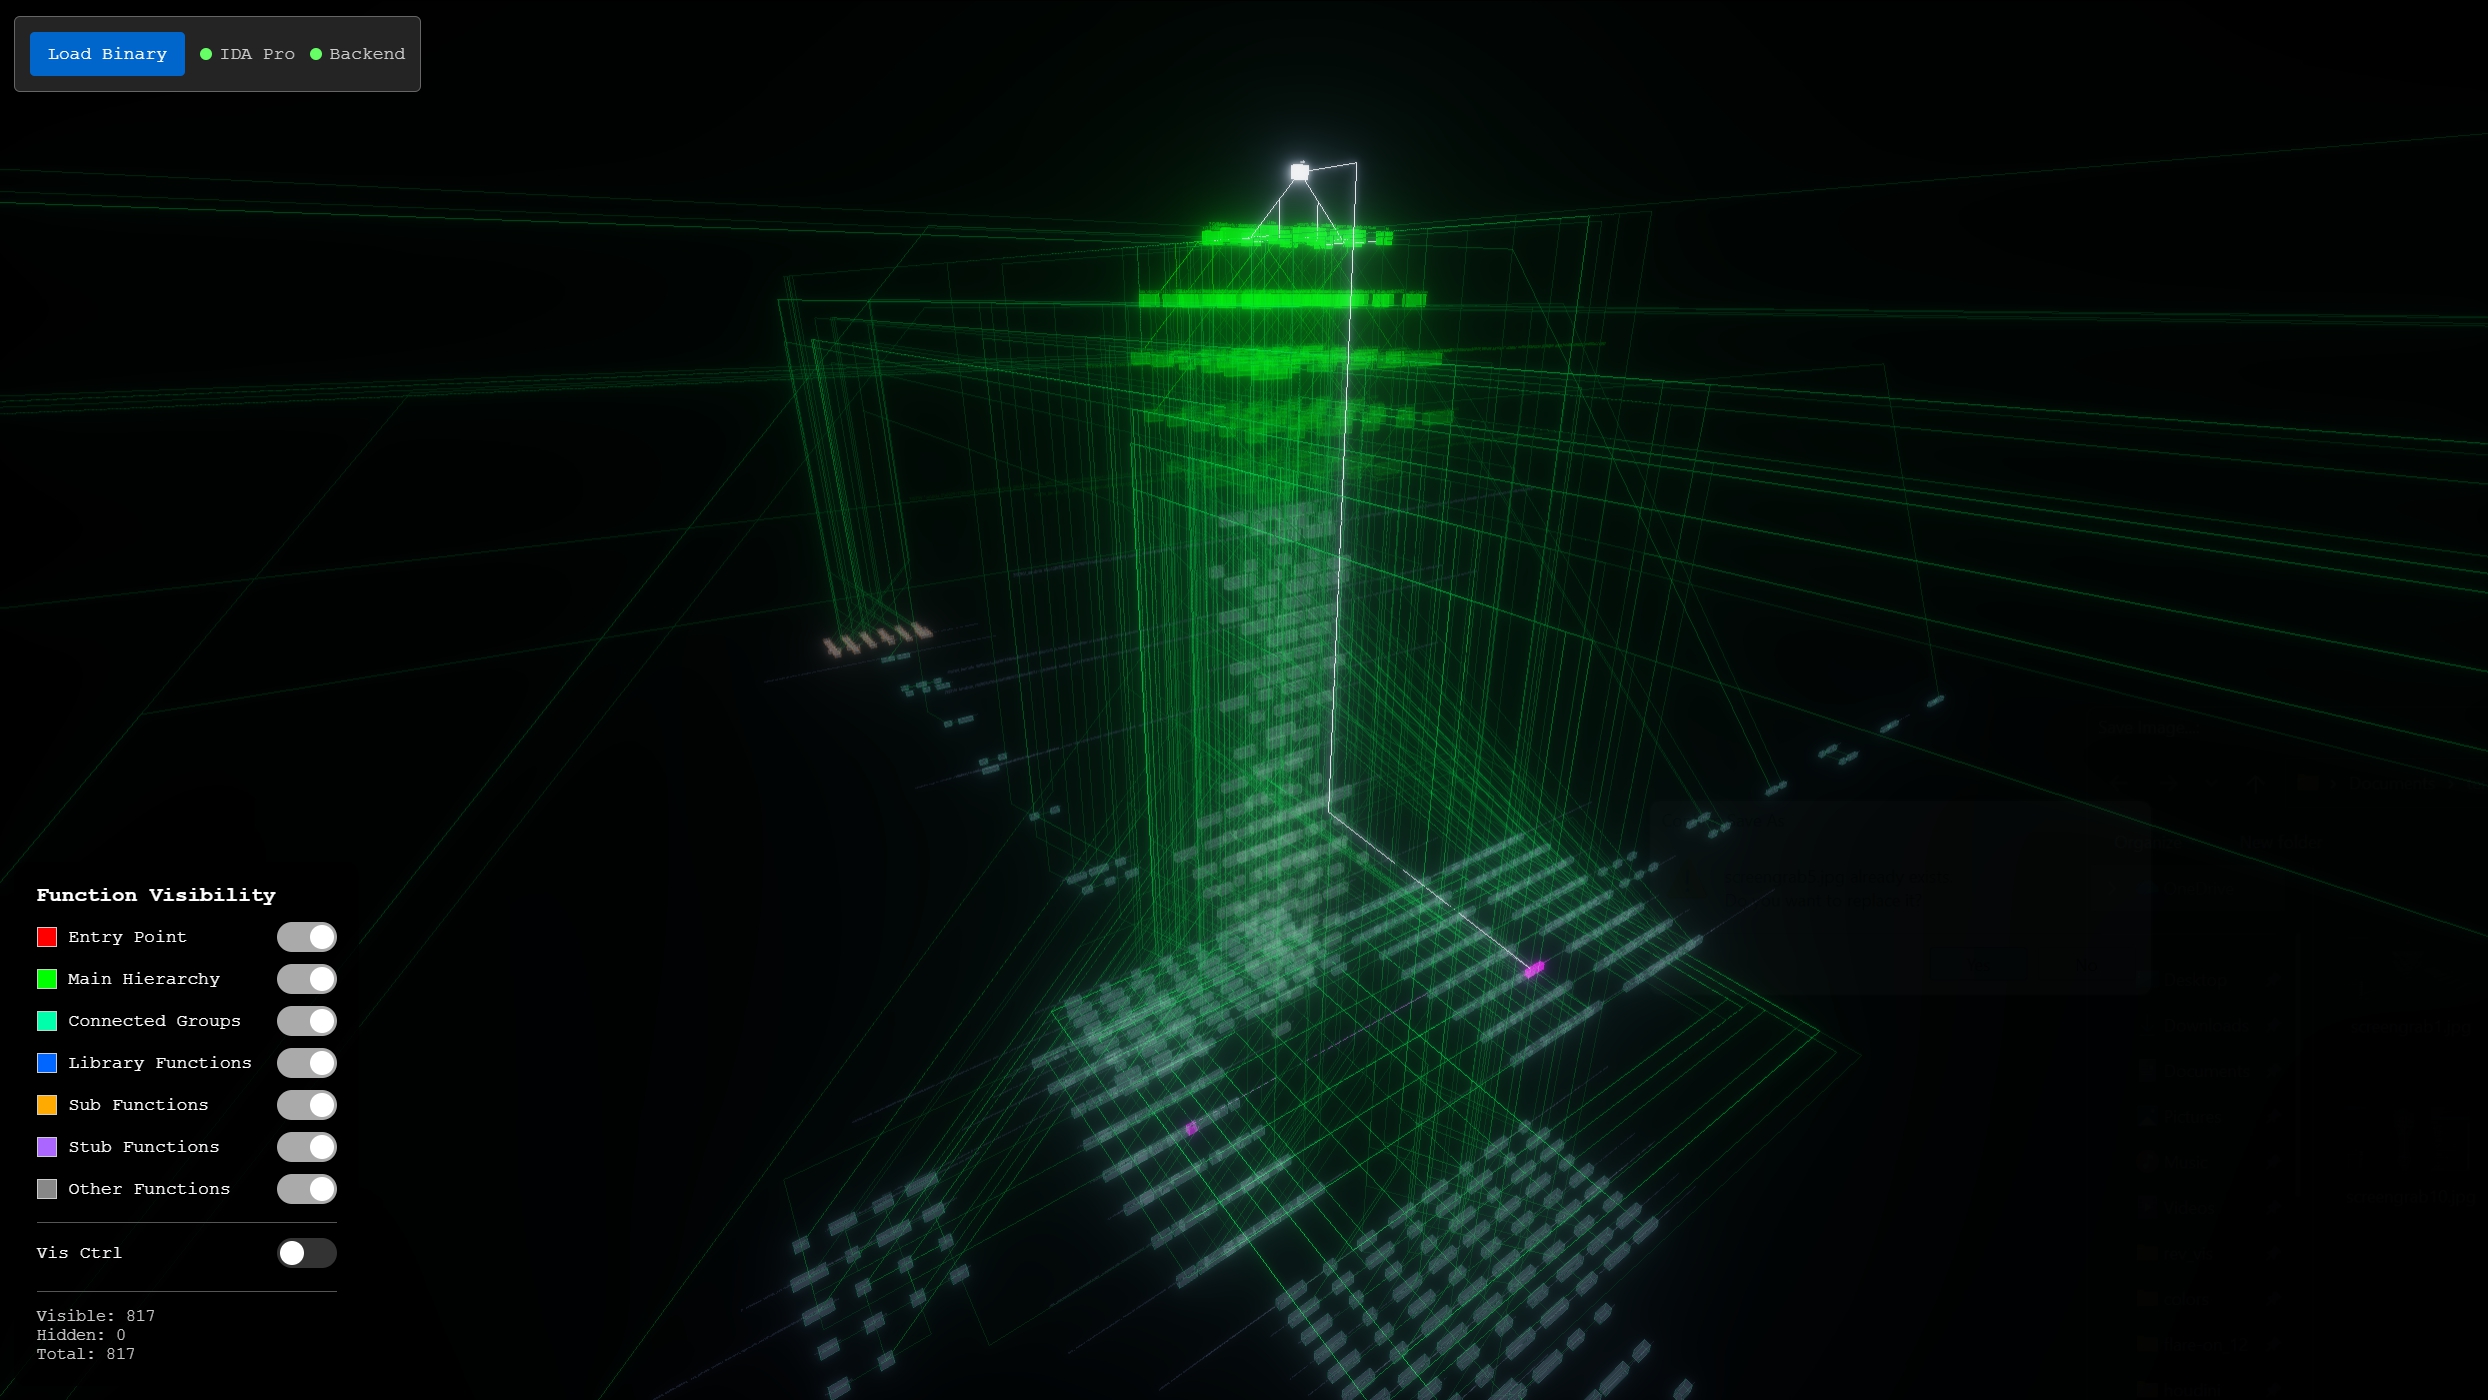
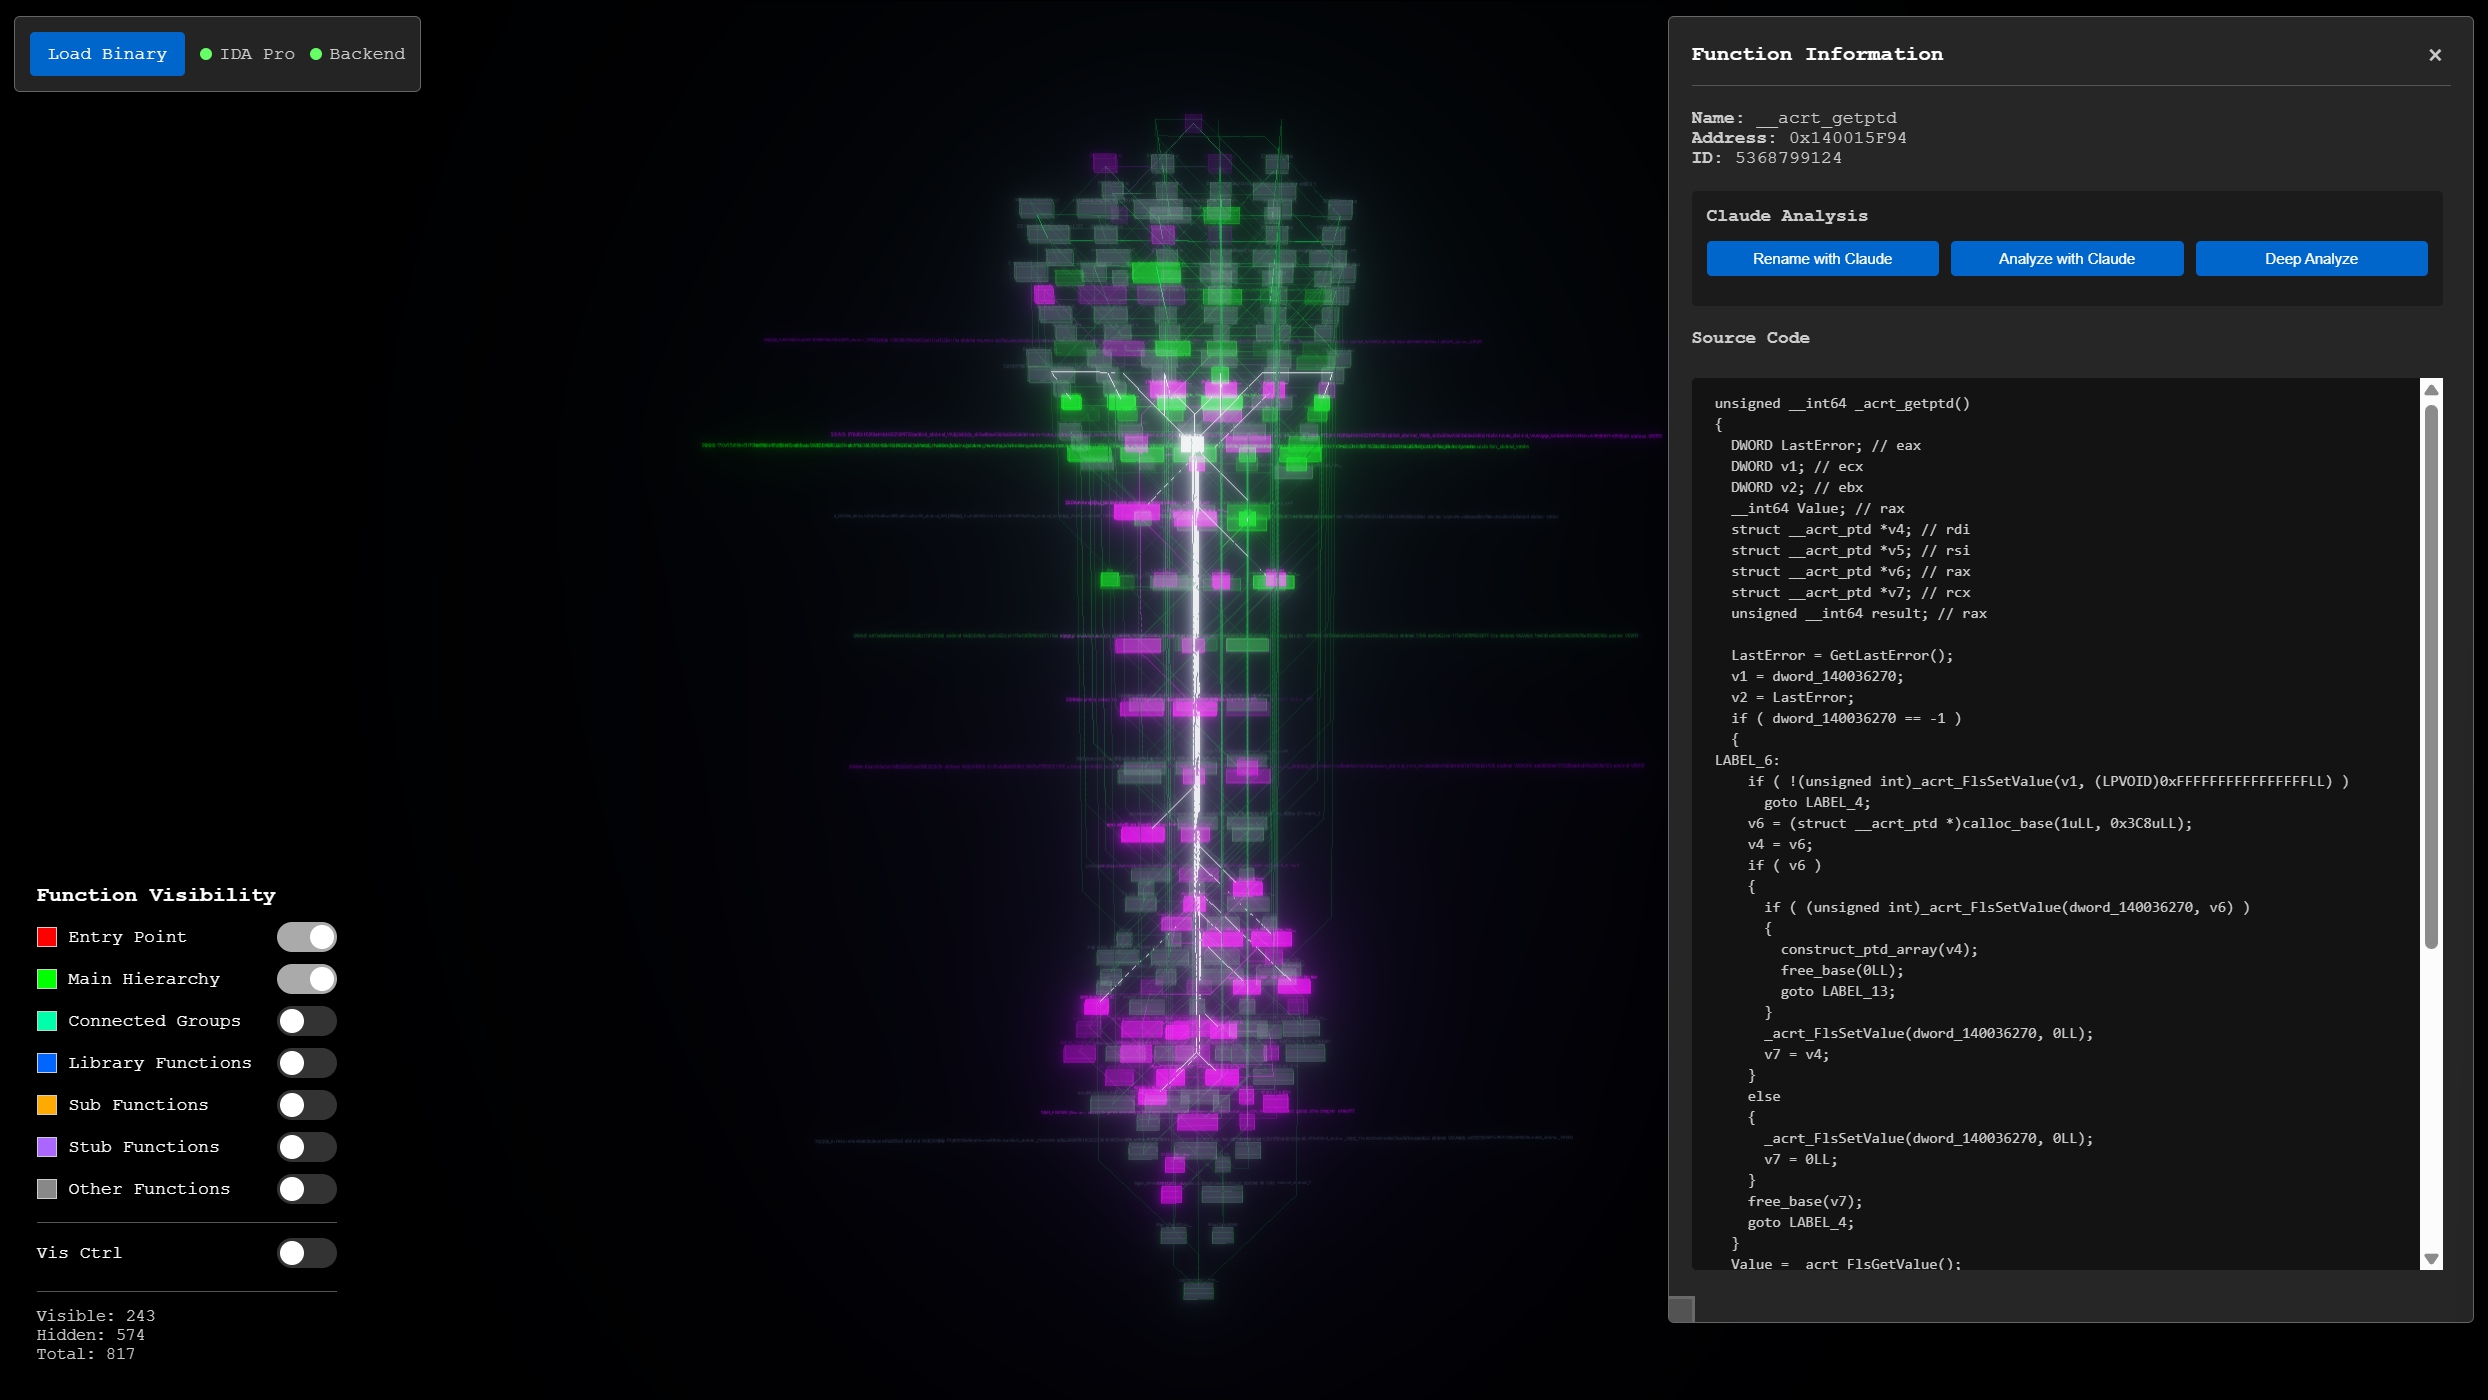
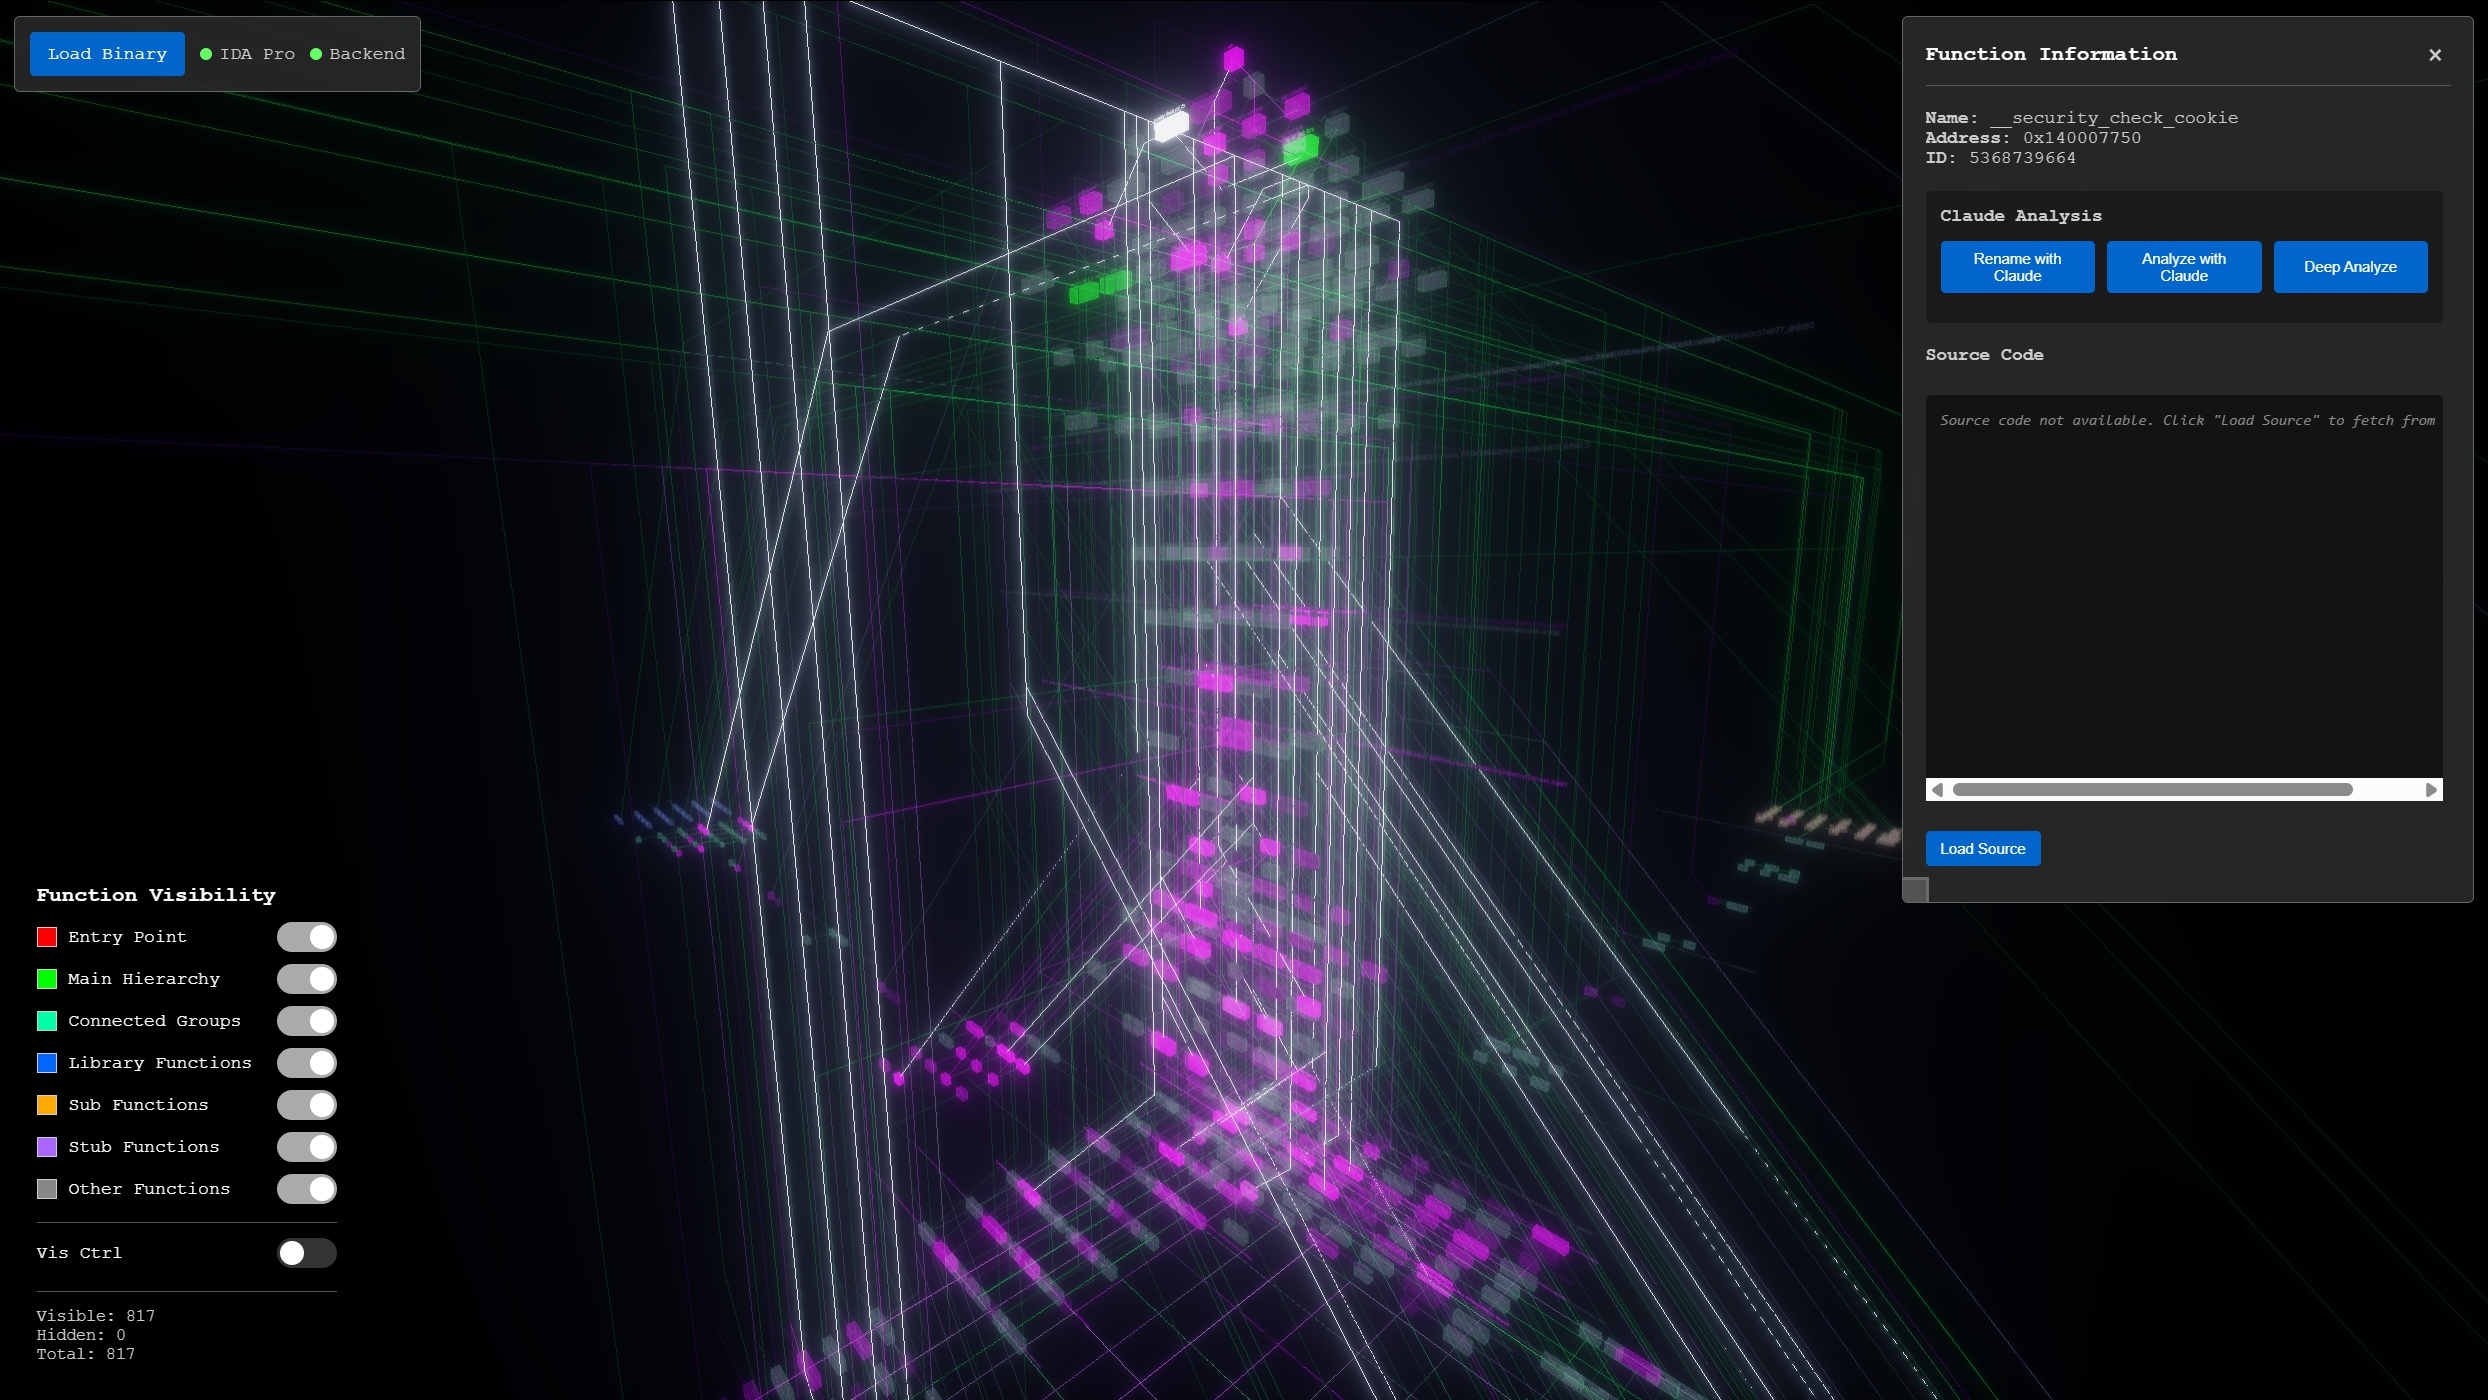 the same kind of highlighting on a large binary - selecting
 __security_check_cookie lights up the entire caller chain in magenta, making it easy to see how far up the call hierarchy it reaches
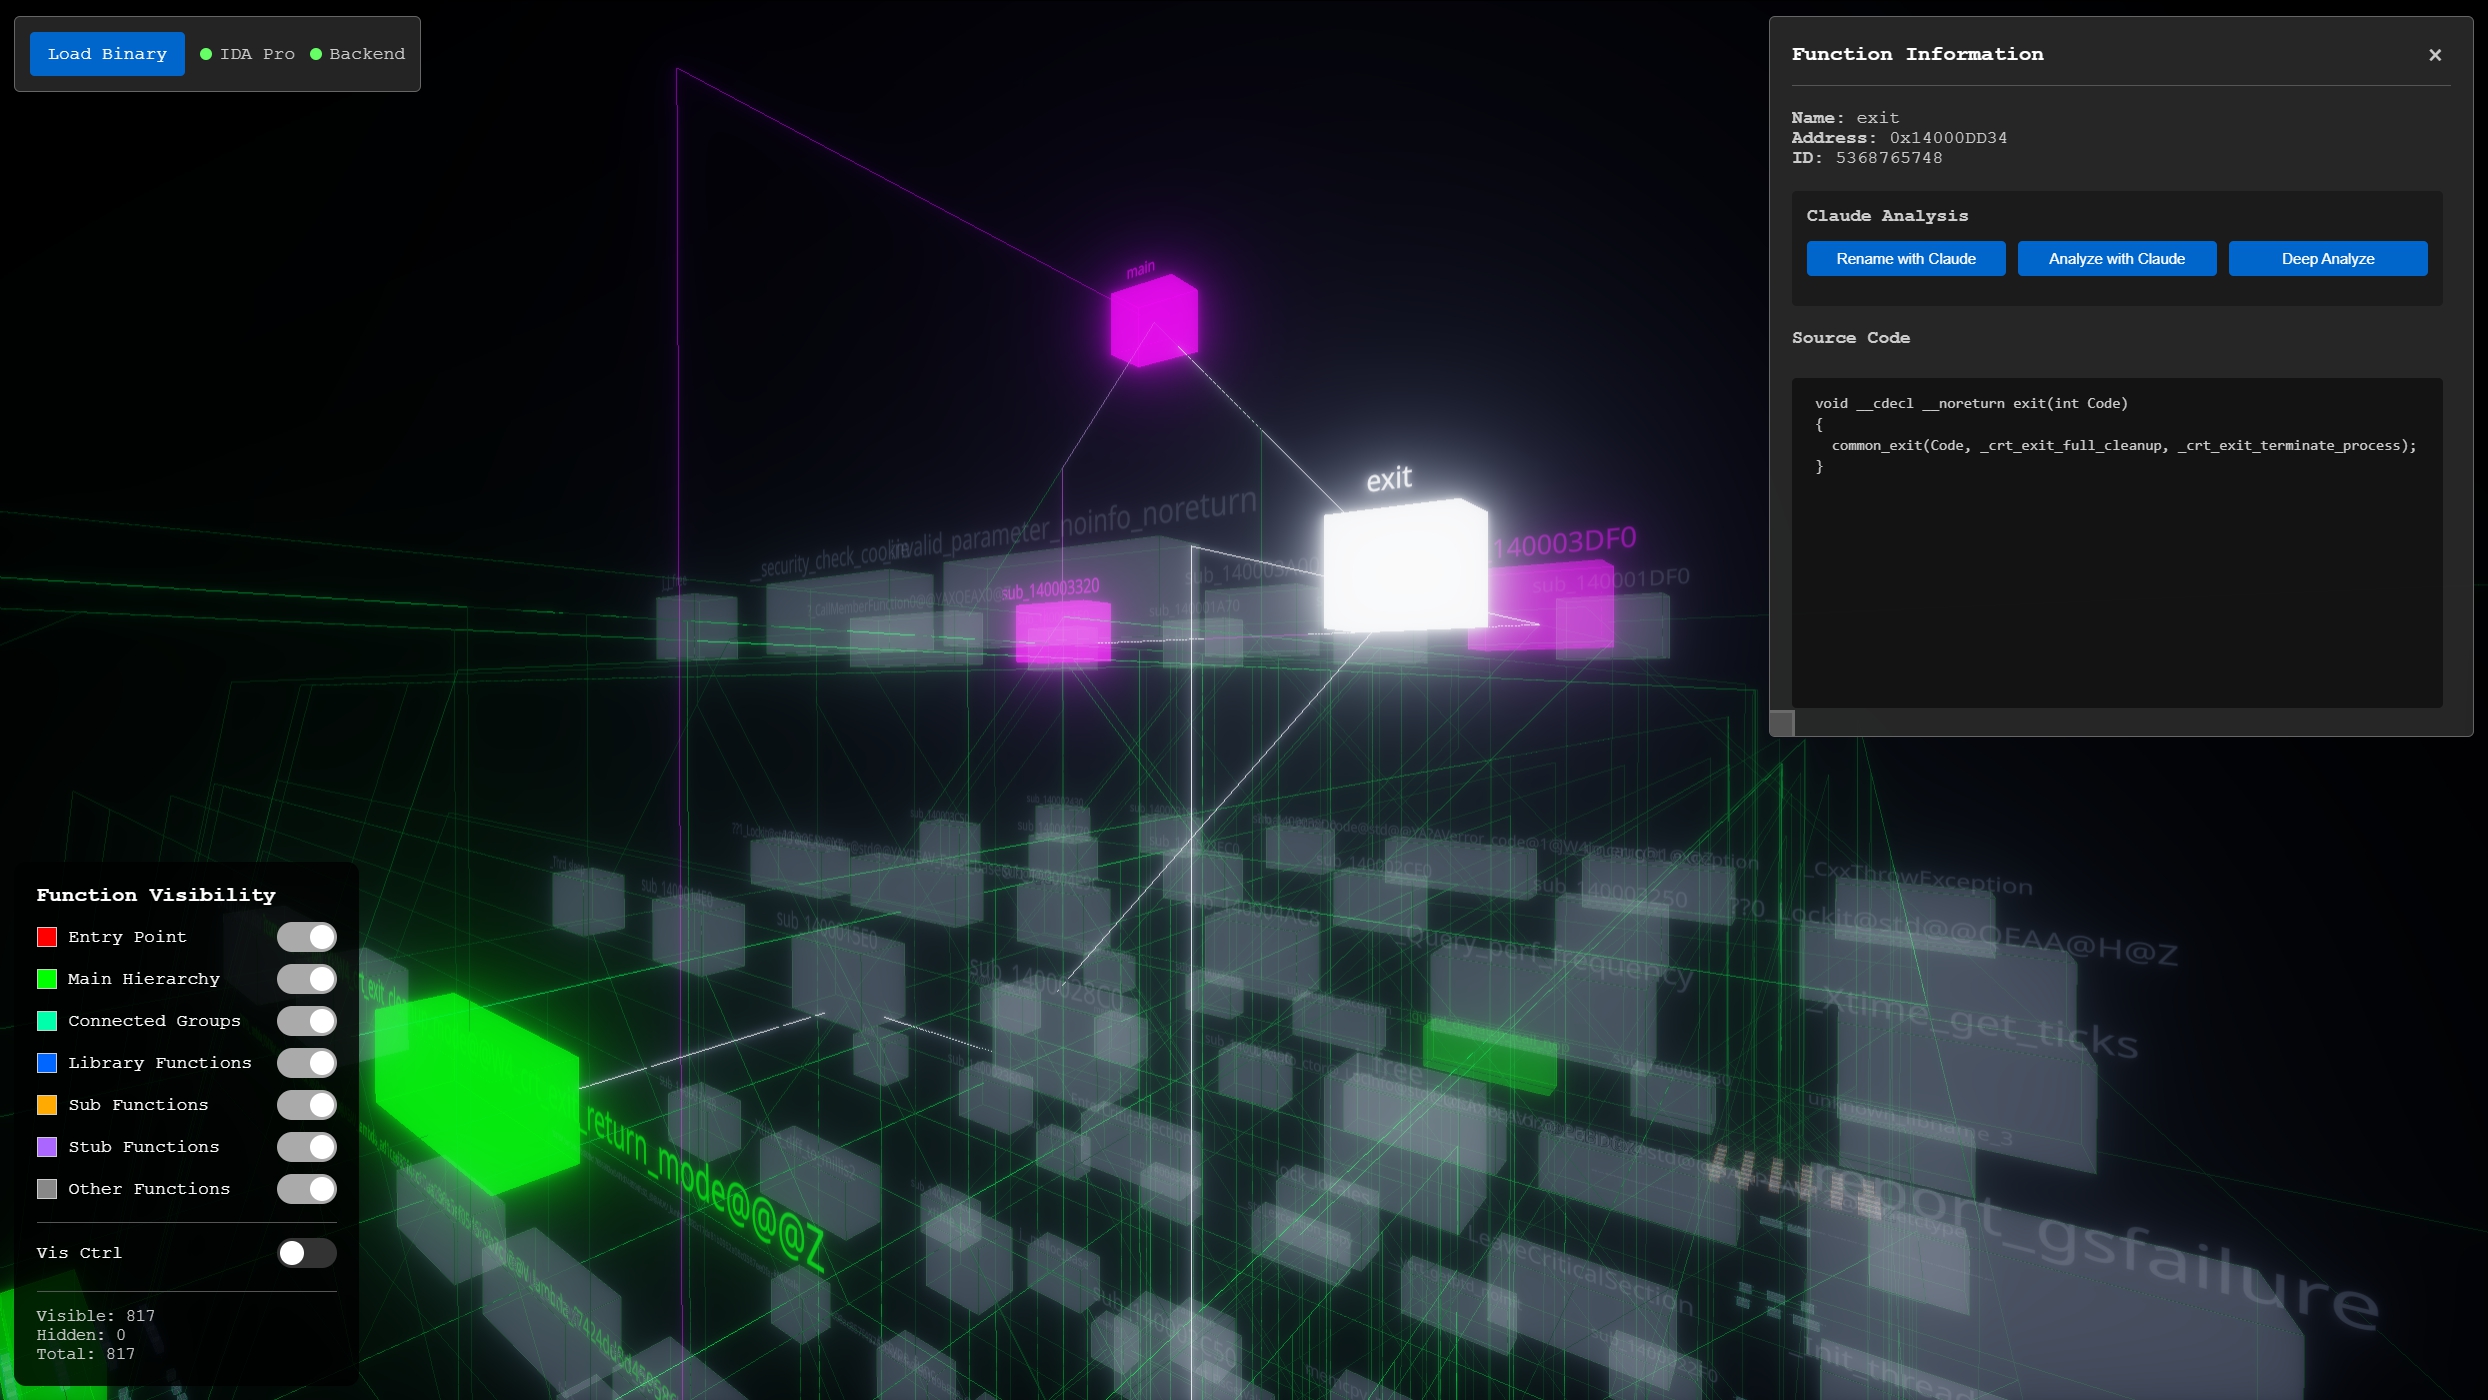 selecting
 exit in the large binary - the green callees below and magenta callers above clearly show the function's role in the execution flow, with source code loaded in the side panel
Function Visibility Controls
The left panel provides toggles for each function category - Entry Point, Main Hierarchy, Connected Groups, Library Functions, Sub Functions, Stub Functions, and Other. This is useful for decluttering the view. For example, hiding library functions and stubs lets you focus on the binary's own logic, while hiding everything except library functions can reveal what external APIs the binary relies on.
Connection Routing
Instead of drawing straight lines between functions (which wasn't very readable at scale), Rev_Vis routes connections with 45-degree angles and grid-snapped segments. For functions on the same hierarchy level, connections route diagonally then align horizontally or vertically. For functions on different levels, the routing drops vertically between layers before connecting.
The result is that connection lines visually highlight the relationships between functions with less overlapping. At a glance you can follow the flow of execution from one function to another more easily Selecting a function makes it even more clear with line highlighting.
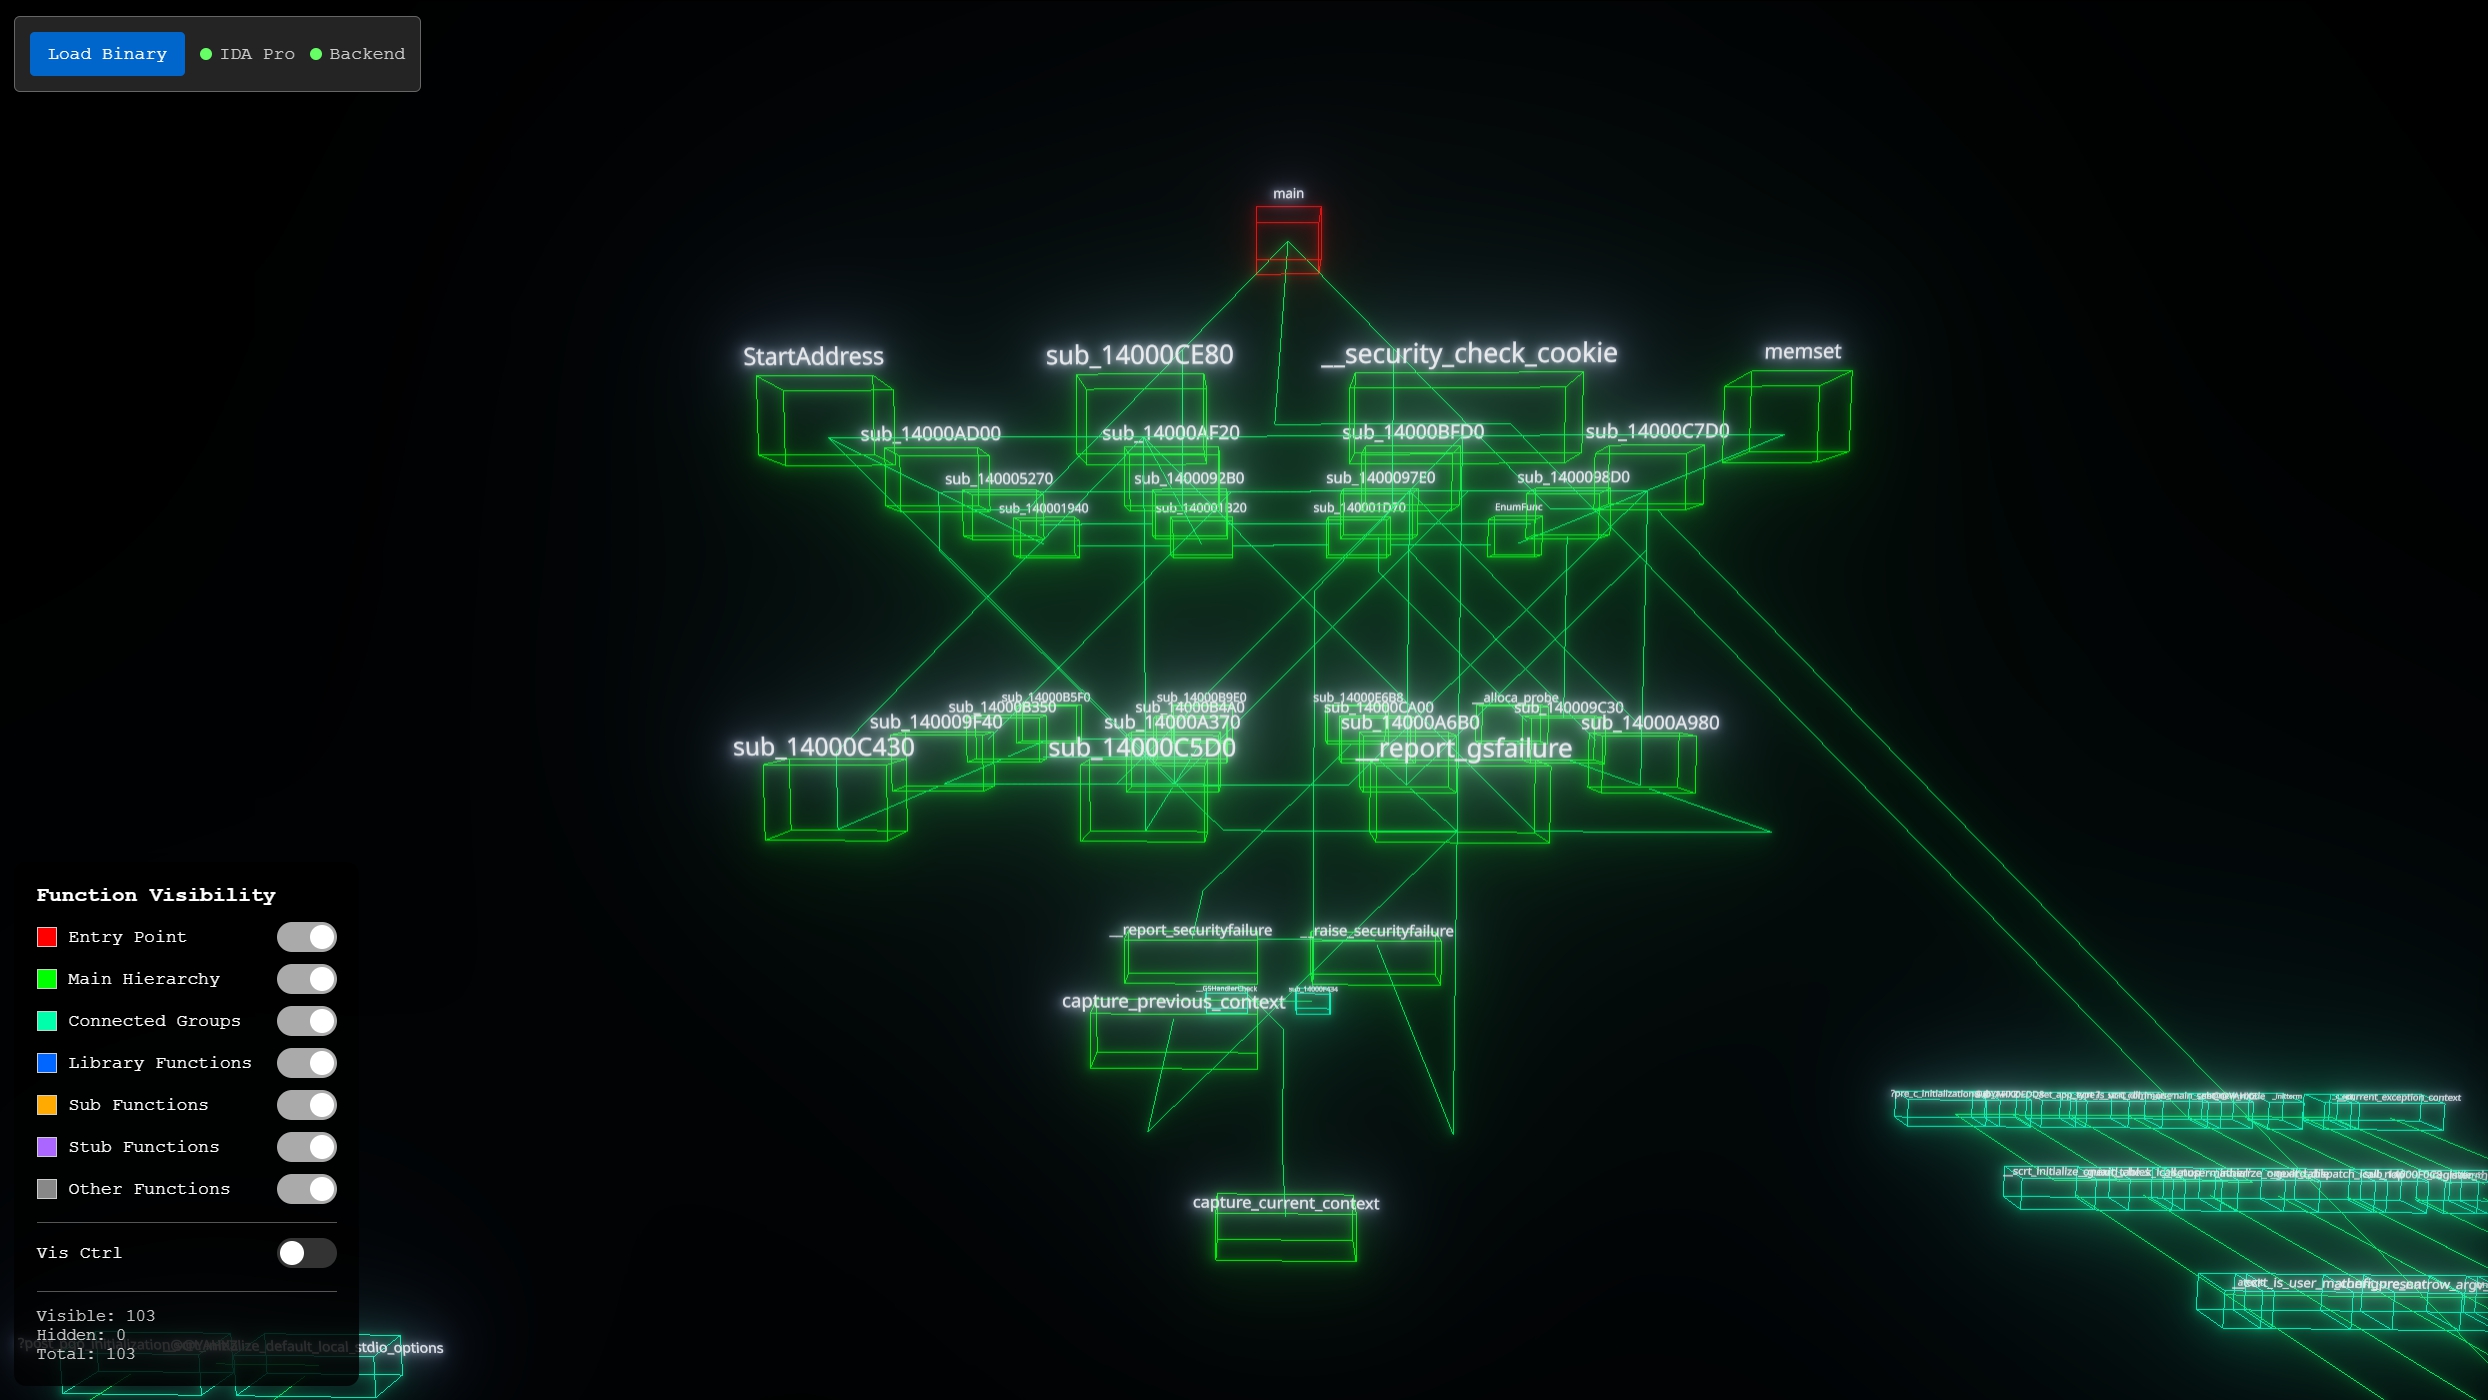 crackme graph - connection lines route between hierarchy levels, with the entry point
 main (red) at the top and orphaned library/stub clusters to the right
Claude Integration
Since I was already using Claude for reverse engineering tasks in IDA Pro, integrating it directly into the visualization made sense. The info panel includes three AI analysis buttons:
Rename with Claude
Sends the decompiled pseudo-C to Claude and gets back a suggested descriptive function name in snake_case. This is especially useful for the hundreds of sub_XXXXXX functions that IDA generates - Claude can usually infer the purpose from the code and suggest a meaningful name, which then gets applied directly in IDA Pro's database.
Analyze with Claude
Automatically tags functions with behavioral categories like cryptography, network_activity, anti_debug, anti_vm, file_write, process_creation, etc. This is helpful for triaging a malware sample - you can quickly identify which functions are doing the interesting work without manually reading each one.
Deep Analyze
This option uses more tokens to get a deeper analysis by also sending the source of the functions callers and callees. This gives Claude the context to understand how a function fits into the broader execution flow, and returns a confidence rating alongside its analysis.
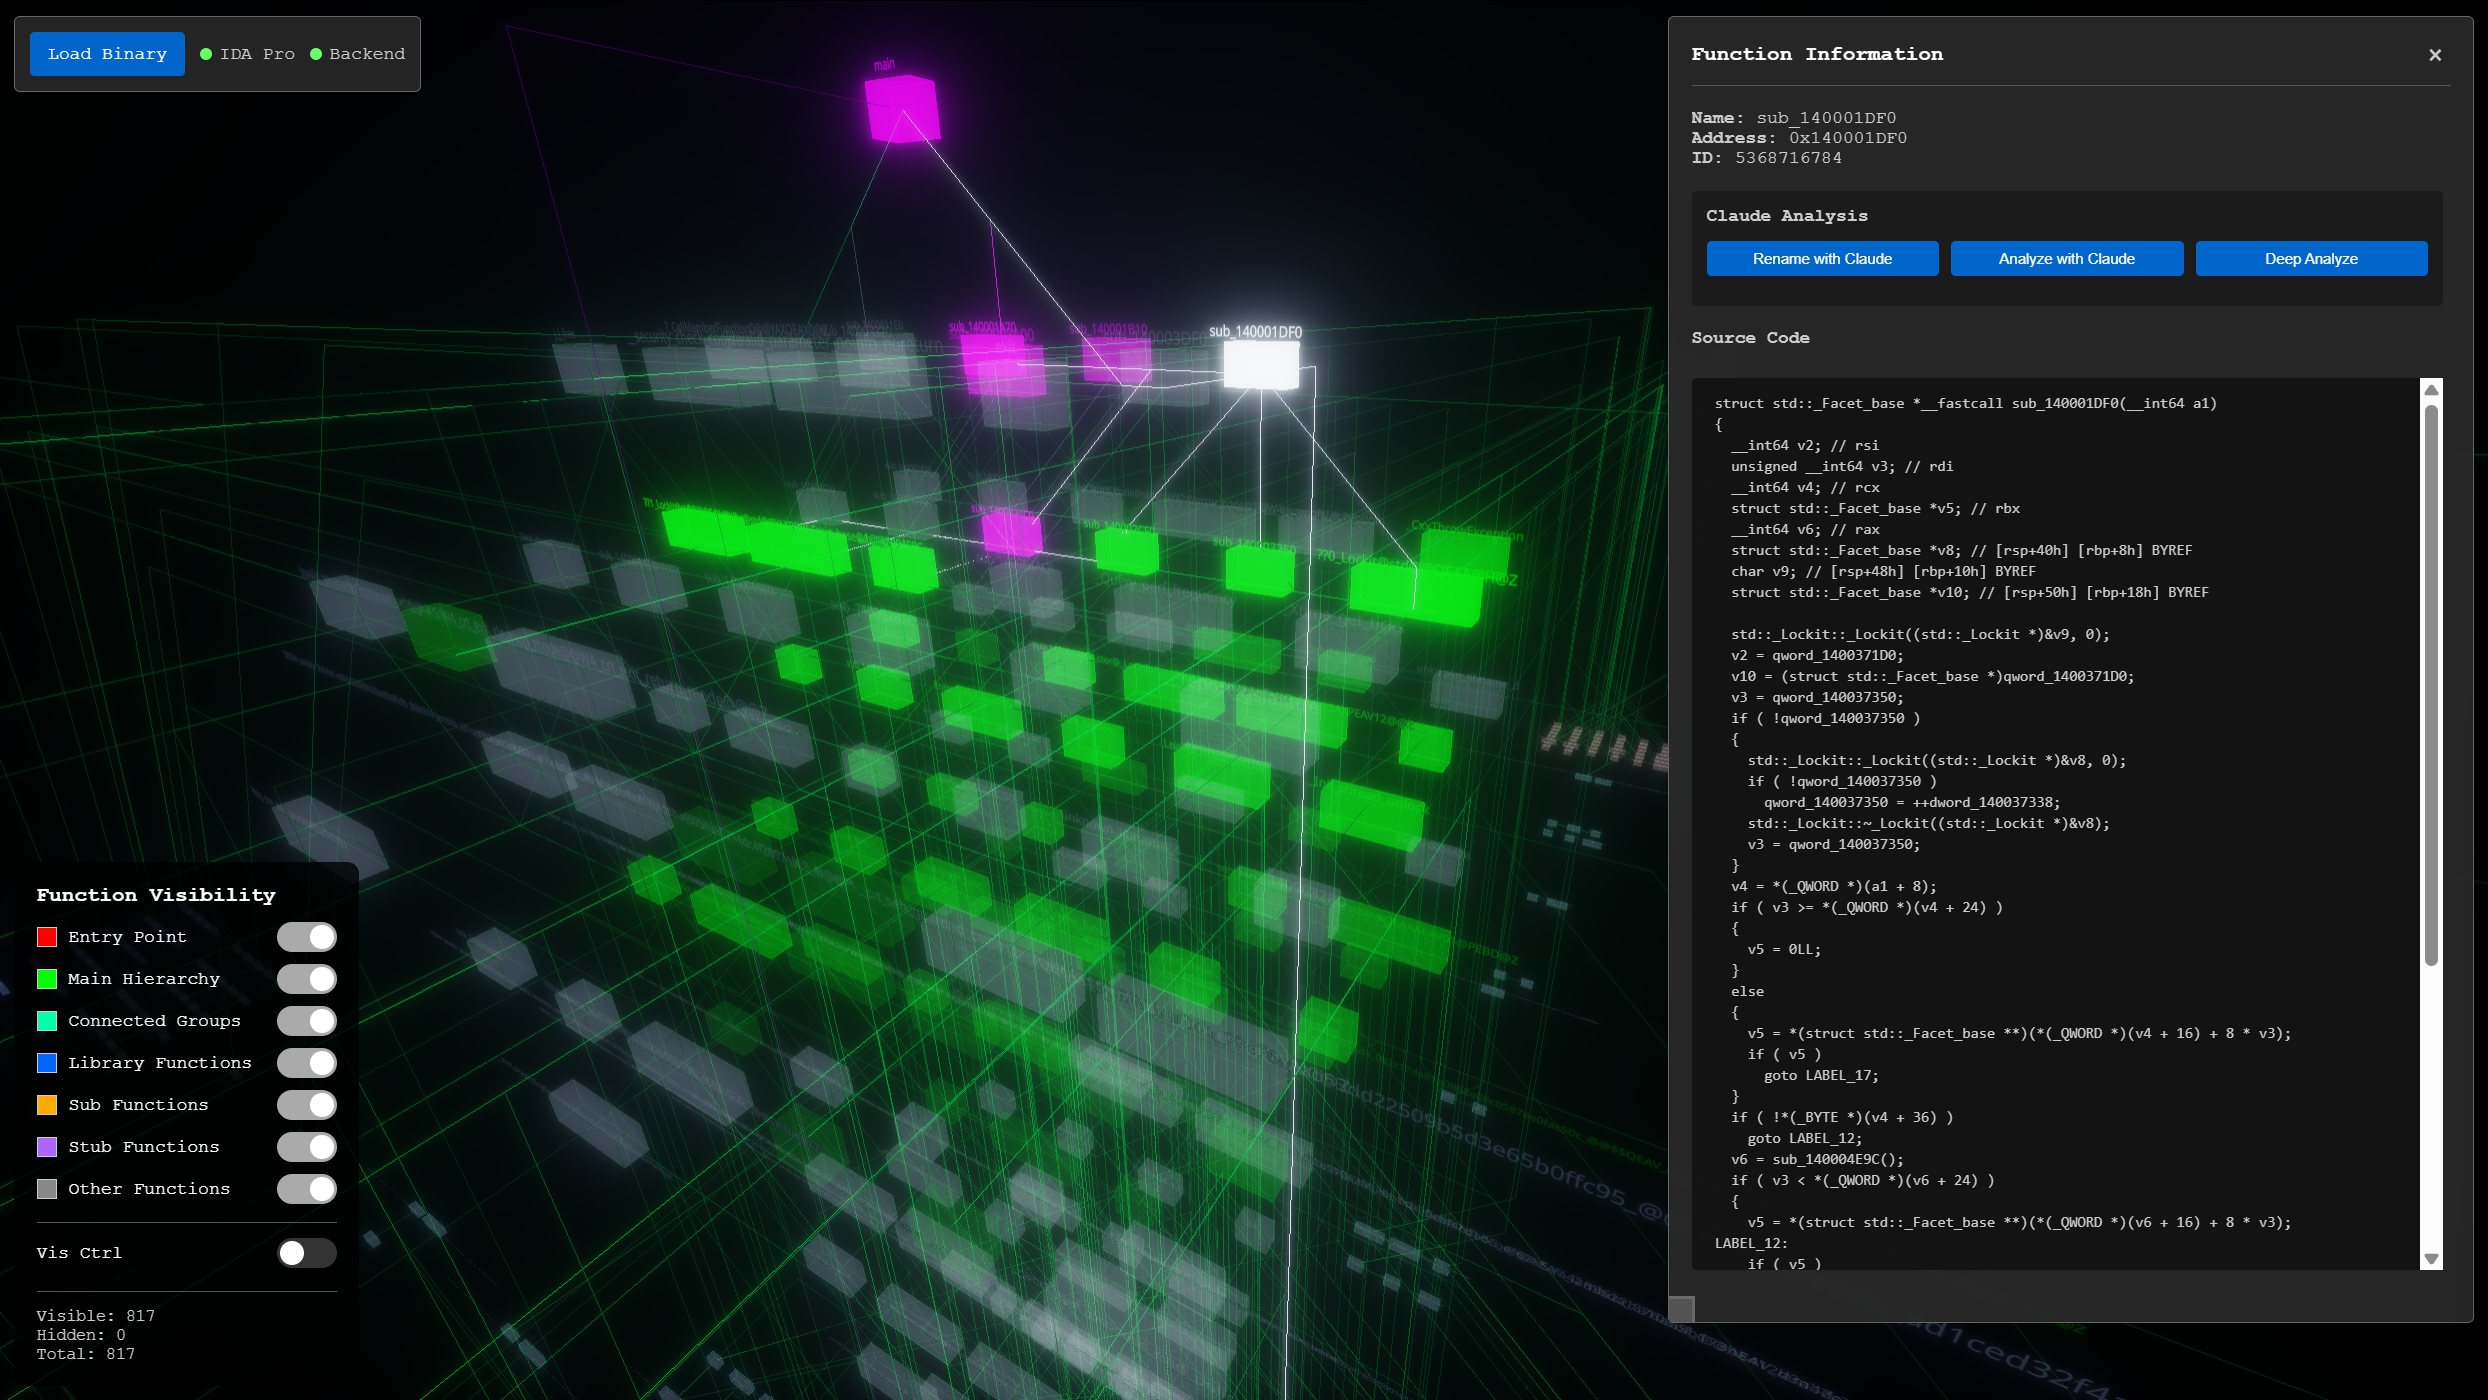 the info panel shows the decompiled source code alongside the Claude analysis buttons (Rename, Analyze, Deep Analyze)
Practical Applications
Malware Analysis
For malware analysis, I've been using the following workflow:
- Load the binary from IDA Pro
- Hide library functions and stubs to focus on the malware's own code
- Select the entry point and trace the call hierarchy downward
- Use Claude's Analyze feature to tag functions with behavioral categories
- Focus on functions tagged with
network_activity,cryptography,anti_debug, etc.
The 3D layout makes it easy to spot structures - for instance, a malware sample that does process hollowing in a specific way might have a distinctive pattern of API calls clustered together.
Understanding Large Binaries
For non-malicious binaries, the visualization helps build a mental model of the codebase structure. The hierarchical layout naturally shows which functions are "hub" functions with many connections, and the orphan clustering reveals how much of the binary is dead code, library code, or utility functions.
At some point, I'd like to open source this; check back for more soon.